Key takeaways
- A nonprofit's overhead ratio is management and general expenses plus fundraising expenses, divided by total expenses, from Form 990 Part IX, line 25 (columns C and D over column A).
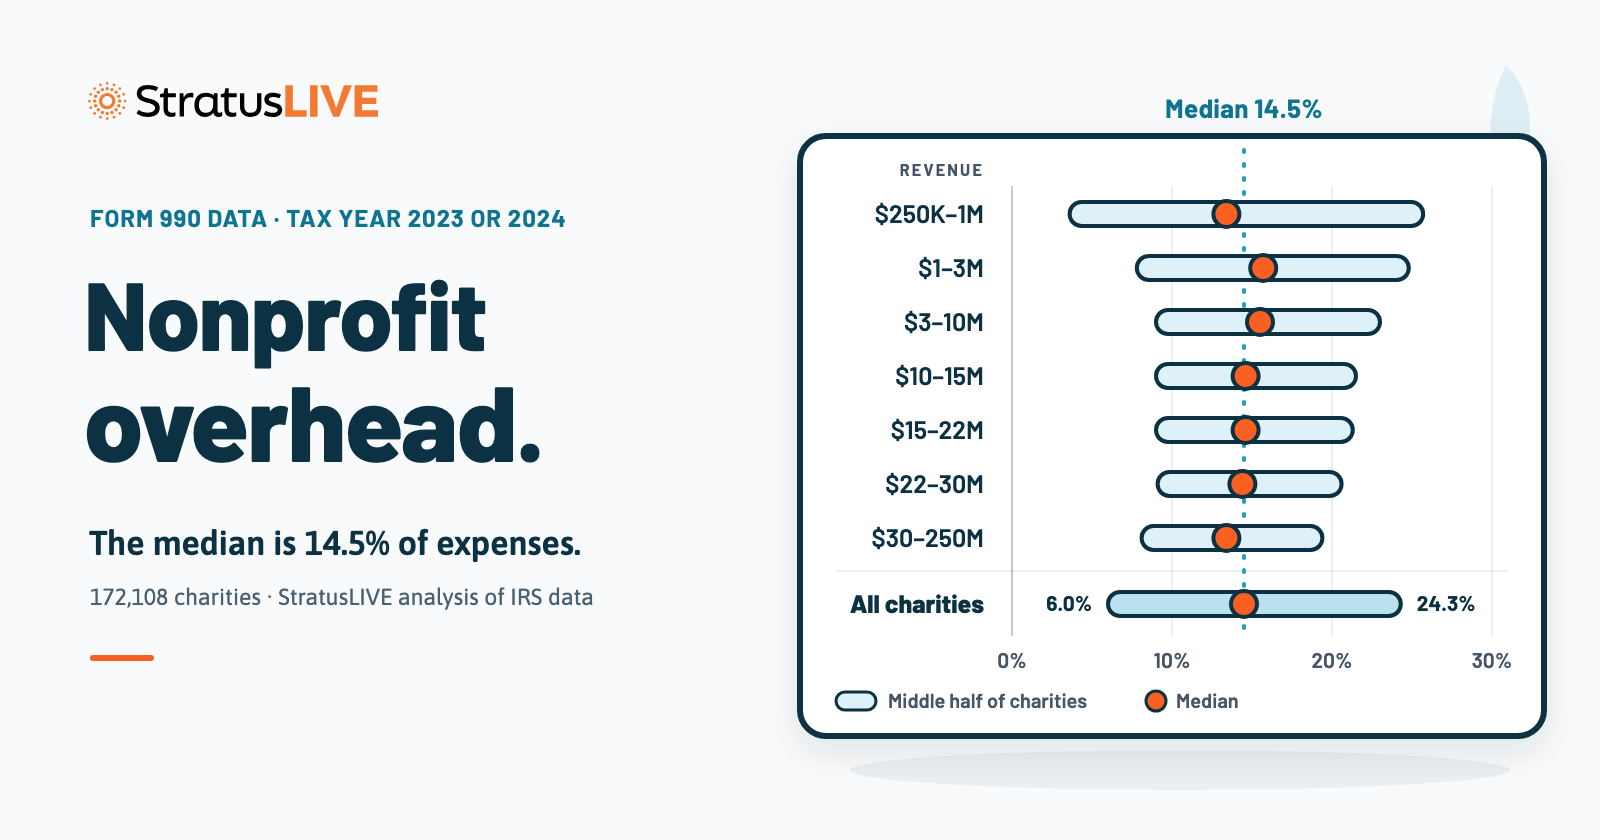
- A StratusLIVE analysis of IRS e-file data for 172,108 U.S. 501(c)(3) charities with $250,000 to $250 million in revenue found a median overhead ratio of 14.5% for tax year 2023 or 2024. The middle half reported between 6.0% and 24.3%.
- Size changes the spread more than the median. The median sits between 13.4% and 15.7% in every revenue band, but 26.1% of charities with $250,000 to $1 million in revenue report more than 25% overhead, against 12.0% of charities with $30 million to $250 million.
- Mission moves the ratio more than size. Among charities with $3 million to $10 million in revenue, the median runs from 8.1% in public safety and disaster relief to 22.3% in arts and culture.
- In the same data, 8.6% of charities reported no overhead at all. That often means shared costs, such as finance staff and the board's work, were charged to programs.
A nonprofit’s overhead ratio is its management and general expenses plus its fundraising expenses, divided by its total expenses, as reported in Part IX of Form 990. A StratusLIVE analysis of IRS e-file data for 172,108 U.S. 501(c)(3) charities with $250,000 to $250 million in revenue found a median overhead ratio of 14.5% for tax year 2023 or 2024, with the middle half between 6.0% and 24.3%. A good overhead ratio is close to the median for charities of your size and mission, with spending you can explain.
What is a nonprofit overhead ratio?
The overhead ratio is the share of a nonprofit’s spending that does not go to program services. On Form 990, Part IX, line 25, it is column C (management and general) plus column D (fundraising), divided by column A (total functional expenses). The program expense ratio is the other side: column B (program services) divided by column A.
| Form 990, Part IX, line 25 | What it holds | Where it goes |
|---|---|---|
| Column A: total functional expenses | Every expense the organization reports | The denominator |
| Column B: program service expenses | Activities that carry out the organization’s exempt purpose | Program expense ratio (B ÷ A) |
| Column C: management and general | Overall operations and management, such as the chief executive’s office | Overhead |
| Column D: fundraising | The cost of asking for gifts and grants | Overhead |
A charity with $4 million in total expenses, $3.4 million in program services, $450,000 in management and general, and $150,000 in fundraising has an overhead ratio of 15% and a program expense ratio of 85%.
What is a good overhead ratio for a nonprofit?
A good nonprofit overhead ratio is close to the median for your size and mission: 14.5% across 172,108 Form 990s, with three in four charities under 24.3%. No federal tax rule sets an overhead limit for public charities. Watchdog lines sit higher: BBB Wise Giving Alliance allows up to 35% overhead; CharityWatch’s highly efficient grade needs 75% on programs.
| Watchdog | Its line | Overhead at that line |
|---|---|---|
| BBB Wise Giving Alliance, Standard 8 | At least 65% of total expenses on program activities | 35% |
| CharityWatch | “Highly efficient” at 75% or more on programs, with $25 or less spent to raise $100; 65% to 74% is its B range, “good” | 25% |
| Charity Navigator, 2026 methodology | Full credit at 85% on programs for donor-funded charities with more than $2 million in revenue and 70% for smaller ones; no credit at 50% or less | 15% or 30% |
Charity Navigator’s full-credit line for its larger donor-funded charities, 85% on programs, sits almost exactly at the median program expense ratio in our data, 85.5%. On the charities’ own Form 990 figures, 23.6% reported more than 25% overhead and 11.3% reported more than 35%. CharityWatch and Charity Navigator adjust or average the figures before they rate, so treat those shares as a rough guide.
The median barely moves with size. The spread does.
| Revenue band | Charities | Median overhead | Middle half | More than 25% | More than 35% |
|---|---|---|---|---|---|
| $250K to $1M | 87,443 | 13.4% | 3.6% to 25.7% | 26.1% | 14.4% |
| $1M to $3M | 41,072 | 15.7% | 7.8% to 24.8% | 24.4% | 10.4% |
| $3M to $10M | 25,088 | 15.5% | 9.0% to 23.0% | 20.2% | 7.3% |
| $10M to $15M | 5,321 | 14.6% | 9.0% to 21.5% | 16.4% | 5.5% |
| $15M to $22M | 3,855 | 14.6% | 9.0% to 21.3% | 15.8% | 5.0% |
| $22M to $30M | 2,430 | 14.4% | 9.1% to 20.6% | 14.9% | 3.9% |
| $30M to $250M | 6,899 | 13.4% | 8.1% to 19.4% | 12.0% | 3.6% |
| All charities | 172,108 | 14.5% | 6.0% to 24.3% | 23.6% | 11.3% |
Source: StratusLIVE analysis of IRS Form 990 e-file data, newest full-year filing for tax year 2023 or 2024. We left out 604 returns that reported no split between program, management and general, and fundraising expenses.
Small charities sit at both ends. With $250,000 to $1 million in revenue, 12.8% reported no overhead at all, and 26.1% reported more than 25%. With $30 million to $250 million, those shares fall to 1.5% and 12.0%. The data covers U.S. 501(c)(3) organizations with $250,000 to $250 million in revenue. It is the same IRS e-file dataset behind our nonprofit fundraising benchmarks, and the methodology lists every line used.
Two other named rules come up in the same searches, and neither one is a spending limit. The 33 percent rule is an IRS test of where support comes from, and the 80/20 rule describes how concentrated a donor file is. Boards that use 80/20 as a program-spending target are using a rule of thumb; the median charity in our data spends 85.5% on programs.
How does overhead vary by mission?
Mission moves the ratio more than size. Among charities with $3 million to $10 million in revenue, the median overhead ratio runs from 8.1% in public safety and disaster relief to 22.3% in arts and culture. The table shows 10 of the 23 mission groups with at least 150 charities in that band, including the highest and the lowest.
| Mission group ($3M to $10M revenue) | Charities | Median overhead | Middle half |
|---|---|---|---|
| Arts, culture, and humanities | 1,385 | 22.3% | 14.7% to 30.4% |
| Youth development | 563 | 18.7% | 12.6% to 24.8% |
| Animal welfare | 389 | 16.6% | 11.6% to 22.2% |
| Education | 4,232 | 15.8% | 9.0% to 23.3% |
| Health care | 1,863 | 15.7% | 8.9% to 24.1% |
| Community improvement | 762 | 14.6% | 7.5% to 22.1% |
| Human services | 3,794 | 14.4% | 8.6% to 20.8% |
| Housing and shelter | 1,205 | 13.6% | 7.3% to 20.6% |
| Food, agriculture, and nutrition | 303 | 8.8% | 3.1% to 18.2% |
| Public safety and disaster relief | 167 | 8.1% | 3.4% to 16.1% |
Source: StratusLIVE analysis of IRS Form 990 e-file data, newest full-year filing for tax year 2023 or 2024. We left out 604 returns that reported no split between program, management and general, and fundraising expenses.
Food banks and other groups that give away donated goods count the value of those goods as program spending, which pulls their overhead ratio down. CharityWatch leaves most donated goods out of its own program share for that reason. Compare your number with your own mission group before you compare it with anyone else’s.
Is a lower overhead ratio always better?
No. In our data, 14,751 charities (8.6%) reported no overhead at all. Every organization has a board and some accounting, so a zero often means shared costs were coded to programs. Our analysis of what fundraising costs against what it raises found the same gap on the fundraising side.
The pattern is old. In 2004, the Nonprofit Overhead Cost Project at the Urban Institute and Indiana University found that 37% of nonprofits with $50,000 or more in private contributions reported no fundraising or special-event costs, and nearly 13% of operating public charities reported no management and general costs. In 2009, Ann Goggins Gregory and Don Howard of the Bridgespan Group named the result “the nonprofit starvation cycle” in the Stanford Social Innovation Review. Four youth-serving nonprofits they studied reported overhead of 13% to 22%, while their actual overhead ran from 17% to 35%.
In June 2013, the heads of BBB Wise Giving Alliance, GuideStar, and Charity Navigator signed an open letter to donors, the start of their “Overhead Myth” campaign. It said the share of spending on administration and fundraising is a poor measure of a charity’s performance. Their 2014 follow-up asked nonprofits to know their true costs and help funders understand them.
What is the difference between overhead and an indirect cost rate?
An indirect cost rate is a grant term: shared costs, such as finance staff and rent, divided by a base of direct costs. Funders use it to decide how much of those shared costs a grant will cover. The overhead ratio divides management and general plus fundraising costs by total expenses, so the two numbers are not interchangeable.
For federal awards, an organization without a negotiated rate may charge a de minimis rate of up to 15% of modified total direct costs (2 CFR 200.414(f)). The rate rose from 10% to 15% when the federal government’s revised grant rules took effect on October 1, 2024. Because the rate is a share of direct costs, it comes to at most about 13% of an award’s total costs.
How to explain your overhead ratio to a board or funder
- Calculate it from your latest Form 990: Part IX, line 25, column C plus column D, divided by column A.
- Compare it with charities of your size and mission. Look up your organization in the free Peer Benchmark Lookup; its full report shows your program expense ratio next to your peers’ median.
- Check the allocation before you defend the number. The IRS lets you use any reasonable method of allocation if you document it. Common methods are time records for staff who split their time and square footage for rent.
- Show three years of figures. A rise that matches a new finance system or a first audit reads differently from a slow drift.
- Name what the spending buys. A line such as “We added a grants accountant and closed the books three weeks faster” answers the question that a percentage cannot.
A donor database and accounting software count as overhead, in fundraising or in management and general, unless you allocate part of them to the programs they support, and so do the staff hours spent reconciling the two. When gift records and the general ledger disagree every month, the reconciliation time is overhead too, and it buys nothing. Ignite, the Active Intelligence Platform from StratusLIVE, keeps gifts, designations, and journal entries on one record in Ignite Finance. Our page for finance leaders covers how fundraising and finance can work from the same gift record.
Frequently asked questions
What counts as overhead for a nonprofit?
Overhead is spending in two Form 990 columns: management and general (column C) and fundraising (column D). Management and general covers the organization's overall operations and management, such as the chief executive's office and accounting. Fundraising is the cost of asking for gifts and grants. Costs that serve programs directly, including program staff and the space they use, are program expenses even when they are salaries or rent.
What is a good program expense ratio for a nonprofit?
The program expense ratio is the other side of the overhead ratio: program service expenses divided by total expenses. Across 172,108 Form 990s for tax year 2023 or 2024, the median was 85.5%. BBB Wise Giving Alliance asks for at least 65%. Charity Navigator gives full credit at 85% for donor-funded charities with more than $2 million in revenue and 70% for smaller ones. CharityWatch's highly efficient grade starts at 75%, on its own adjusted figures.
Is 20% overhead too high for a nonprofit?
Not by itself. A 20% overhead ratio is above the median of 14.5% in Form 990 data for tax year 2023 or 2024, but three in four charities report less than 24.3%. It also sits inside the BBB Wise Giving Alliance line of 35% and the CharityWatch line of 25%, though Charity Navigator gives only partial credit for 80% on programs to donor-funded charities with more than $2 million in revenue. Compare it with charities of your size and mission, and be ready to say what the spending pays for.
Do charity watchdogs reward lower overhead?
Two of the three stop at a line. Charity Navigator's 2026 methodology gives no credit for a program expense ratio of 50% or less and full credit at 85% for donor-funded charities with more than $2 million in revenue, so overhead below 15% earns nothing extra. BBB Wise Giving Alliance sets a floor of 65% on programs and has no higher tier. CharityWatch keeps rewarding it: its program grade rises from A- at 75% to A+ at 90% or more.
What is the average indirect cost rate for nonprofits?
There is no national average. A 2016 Bridgespan study of 20 high-performing nonprofits found a median indirect cost rate of 40% of direct costs, with a range of 21% to 89%. For federal awards, an organization without a negotiated rate may charge a de minimis rate of up to 15% of modified total direct costs, up from 10% before October 1, 2024 (2 CFR 200.414(f)).
Why do some nonprofits report zero overhead?
Often because shared costs were coded to programs. Every charity has a board and some accounting, and most ask for money, so zero management and general plus fundraising expense is rarely real; some zeros are reporting errors. In Form 990 data for tax year 2023 or 2024, 8.6% of charities reported no overhead at all, and the share was highest, 12.8%, among charities with $250,000 to $1 million in revenue.
How can a nonprofit lower its overhead ratio?
Check the allocation before you cut. The IRS lets you allocate shared costs by any reasonable method you document. Use time records for staff who split their time, and a method such as square footage for rent and other shared costs. If the ratio is still high, look for costs that buy nothing, such as duplicate systems or manual reconciliation, before you cut the finance or fundraising staff who keep the organization running.
Where can I find a nonprofit's overhead ratio?
On its Form 990, Part IX, line 25: add column C (management and general) and column D (fundraising), then divide by column A (total). Recent Form 990s are free to read on ProPublica's Nonprofit Explorer and on Candid. StratusLIVE's free Peer Benchmark Lookup includes the program expense ratio in its full report, next to the median for the organization's peers.