Key takeaways
- Among U.S. 501(c)(3)s that reported fundraising costs on a 2023 or 2024 Form 990, the median raised $14.60 for every $1 spent on fundraising. That is about 6.8 cents to raise a dollar.
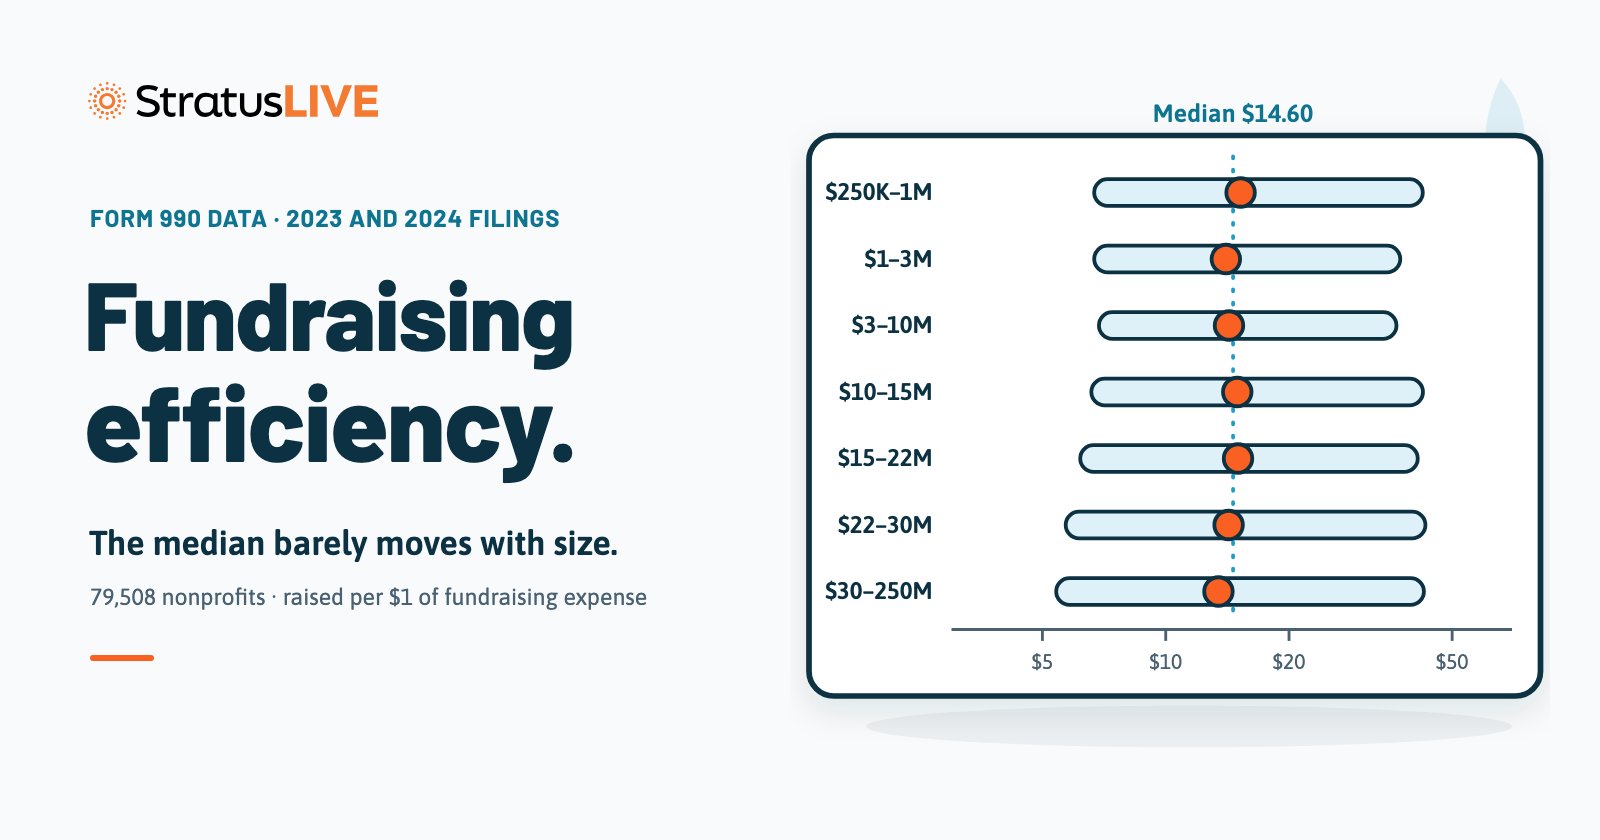
- Size barely moves the median ratio. It sat between $13.45 and $15.23 raised per $1 in every revenue band from $250,000 to $250 million. The share of the budget spent on fundraising peaked at 4.7% in the $1 million to $3 million band and fell to 1.7% above $30 million.
- Mission moves the ratio far more than size. Across the 19 mission groups with at least 150 organizations in the $3 million to $10 million revenue band, the median ran from $8.31 for arts and culture to $24.80 for community improvement.
- Nearly half (48%) of organizations that reported contributions reported no fundraising expense at all. That means a ratio built from Form 990 data describes only the organizations that report the cost.
- Published standards are ceilings, not benchmarks. Charity Navigator gives full credit at 20 cents or less to raise a dollar. On one year of Form 990 data, 83% of filers spent 20 cents or less.
A good fundraising efficiency ratio holds at or above the median for nonprofits of your mission and size while contributions keep growing. Among 79,508 U.S. 501(c)(3) organizations that reported fundraising costs on a 2023 or 2024 Form 990, the median raised $14.60 for every $1 spent on fundraising. That is about 7 cents to raise a dollar. Charity Navigator gives full credit at 20 cents or less.
The middle half of those organizations raised between $6.63 and $39.82 per dollar. Unless another source is named, every figure here comes from StratusLIVE’s analysis of public IRS Form 990 e-file data for 501(c)(3)s with $250,000 to $250 million in revenue. The same data powers a free lookup where you can compare your nonprofit’s ratio with its peers. The methodology lists every Form 990 line it uses.
What is a fundraising efficiency ratio?
A fundraising efficiency ratio compares what a nonprofit raises with what it spends to raise it. Dollars raised per dollar spent divides contributions by fundraising expense, so higher is better. Cost to raise a dollar divides the other way, so lower is better. The two are one measure turned over: $14.60 raised per $1 equals 6.8 cents to raise a dollar.
| Version | Formula | Median, 2023 and 2024 Form 990s | Read it as |
|---|---|---|---|
| Raised per dollar spent | Contributions ÷ fundraising expense | $14.60 | Higher is better |
| Cost to raise a dollar | Fundraising expense ÷ contributions | 6.8 cents | Lower is better |
| Fundraising investment rate | Fundraising expense ÷ total expenses | 4.1% | Context, not a score |
On Form 990, the two inputs are Part I line 8 (contributions and grants) and Part I line 16b (total fundraising expenses). Line 8 carries the total from Part VIII line 1h: gifts from individuals, foundations, and companies; donated goods; the gift portion of event tickets; and government grants. Donated services don’t count. Line 16b carries the fundraising column of Part IX, the statement of functional expenses. The fundraising investment rate adds what the ratio alone can’t show: the share of the whole budget that goes to raising money.
What is a good fundraising efficiency ratio?
Judge it against your peers first and the published standards second. On 2023 and 2024 filings, the top quarter raised $39.82 or more per dollar (2.5 cents or less to raise a dollar). The bottom quarter raised less than $6.63 (more than 15 cents). The watchdog standards, at 20 to 35 cents, sit well above the median filer’s cost. They mark a ceiling, not a target.
| Standard | The line | In raised-per-dollar terms | 2023 and 2024 filers past the line |
|---|---|---|---|
| BBB Wise Giving Alliance, Standard 9 | Spend no more than 35% of related contributions on fundraising | At least $2.86 per $1 | 7.7% spent more than 35 cents |
| CharityWatch | A cost to raise $100 of $25 or less is one of its tests for a highly efficient charity | At least $4.00 per $1 | 12.7% spent more than 25 cents |
| Charity Navigator Encompass rating | Full credit at 20 cents or less per dollar, no credit above 50 cents, scaled in between; three-year averages; donor-supported charities with more than $2 million in revenue | Full credit at $5.00 or more per $1 | Above $2 million in revenue: 17.7% spent more than 20 cents, 4.8% more than 50 cents |
Last column: StratusLIVE analysis of IRS Form 990 e-file data, one year per organization. The standards define their inputs differently: Charity Navigator scores only donor-supported charities on three-year averages, and CharityWatch leaves out in-kind gifts. Read the shares as approximations.
Two figures that circulate online are out of date or wrong. The first, a 10-cent line for top marks, comes from Charity Navigator’s earlier scoring table. Its current methodology gives full credit at 20 cents and scores charities whose contributions are mostly physical goods on a stricter scale. Our post on Charity Navigator’s rating system covers the wider change. The second is a 20% limit sometimes credited to BBB. The BBB standard is 35%. The 33 percent rule is something different: an IRS public support test, not a limit on fundraising cost.
Most filers cleared these lines. Only 1.8% of organizations with a ratio spent more on fundraising than they raised. A line that more than 80% of filers meet tells you little about where you stand. Peer medians tell you more.
Why is the Form 990 median lower than survey benchmarks?
Because the 990 counts differently. It treats government grants and donated goods as raised, keeps direct event costs out of fundraising expense, and depends on how each filer allocates staff time. The Marts & Lundy Fundraising Investment Study 2025, drawn from 243 organizations in seven countries, found a median cost per dollar raised of 18 cents, against 6.8 cents on the 990.
Filers that report very small fundraising costs also pull the median cost down. Among nonprofits that reported at least $10,000 in fundraising expense, the median raised $11.55 per $1. That is about 9 cents to raise a dollar.
Do larger nonprofits raise more per fundraising dollar?
No. The median barely moves with size. In every revenue band from $250,000 to $250 million, the median organization raised between $13.45 and $15.23 per dollar of fundraising expense. Two things do shift with size: the bottom of the range and the share of the budget that goes to fundraising.
| Revenue band | Organizations with a ratio | 25th percentile | Median | 75th percentile | Cost to raise $1 at the median | Fundraising investment rate (median) |
|---|---|---|---|---|---|---|
| $250K to $1M | 33,830 | $6.69 | $15.23 | $42.40 | 6.6 cents | 4.5% |
| $1M to $3M | 21,728 | $6.69 | $14.02 | $37.37 | 7.1 cents | 4.7% |
| $3M to $10M | 14,149 | $6.87 | $14.27 | $36.58 | 7.0 cents | 4.1% |
| $10M to $15M | 2,846 | $6.58 | $14.95 | $42.44 | 6.7 cents | 3.0% |
| $15M to $22M | 2,059 | $6.18 | $15.01 | $41.22 | 6.7 cents | 2.5% |
| $22M to $30M | 1,302 | $5.70 | $14.24 | $43.04 | 7.0 cents | 2.3% |
| $30M to $250M | 3,594 | $5.40 | $13.45 | $42.66 | 7.4 cents | 1.7% |
| All bands | 79,508 | $6.63 | $14.60 | $39.82 | 6.8 cents | 4.1% |
Source: StratusLIVE analysis of IRS Form 990 e-file data (NCCS), tax years 2023 and 2024, edition 2026-09-30. Organizations with contributions and fundraising expense both above zero; ratios above $1,000 per dollar are left out as reporting errors. The investment-rate column counts every organization that reported fundraising expense (82,339 in all), so its counts differ slightly.
The 25th percentile fell from $6.69 in the two bands below $3 million to $5.40 above $30 million. The fundraising investment rate peaked at 4.7% in the $1 million to $3 million band and fell to 1.7% above $30 million. Larger organizations rely less on gifts. For the median organization at $250,000 to $1 million, contributions were 74% of revenue and program service revenue was 5%. Above $30 million, contributions were 16% and program service revenue, from sources such as tuition and patient fees, was 76%. Fundraising becomes a smaller slice of total spending even when the ratio holds steady.
How does fundraising efficiency vary by mission?
Far more than by size. Across the 19 mission groups with at least 150 organizations in the $3 million to $10 million revenue band, the median ran from $8.31 per dollar for arts and culture to $24.80 for community improvement.
| Mission group, $3M to $10M revenue | Organizations with a ratio | 25th percentile | Median | 75th percentile | Cost to raise $1 at the median |
|---|---|---|---|---|---|
| Arts, culture, and humanities | 1,177 | $4.81 | $8.31 | $17.34 | 12.0 cents |
| Animal welfare | 318 | $5.64 | $10.02 | $17.35 | 10.0 cents |
| Recreation and sports | 322 | $6.13 | $10.09 | $23.51 | 9.9 cents |
| Youth development | 457 | $5.32 | $10.57 | $24.50 | 9.5 cents |
| Disease and disorder organizations | 182 | $6.45 | $12.53 | $34.10 | 8.0 cents |
| Education | 1,921 | $5.83 | $13.00 | $37.15 | 7.7 cents |
| Health care | 740 | $6.46 | $14.38 | $41.82 | 7.0 cents |
| Employment and workforce | 178 | $7.78 | $15.90 | $39.43 | 6.3 cents |
| Civil rights and advocacy | 192 | $8.76 | $15.95 | $37.77 | 6.3 cents |
| International affairs | 372 | $8.67 | $16.06 | $35.76 | 6.2 cents |
| Mental health and crisis intervention | 287 | $7.65 | $17.06 | $48.15 | 5.9 cents |
| Human services | 2,223 | $8.56 | $17.39 | $44.05 | 5.8 cents |
| Environment | 532 | $8.61 | $17.52 | $42.33 | 5.7 cents |
| Philanthropy and grantmaking | 668 | $8.89 | $17.55 | $45.66 | 5.7 cents |
| Religion | 341 | $8.07 | $17.62 | $39.46 | 5.7 cents |
| Housing and shelter | 501 | $9.41 | $18.79 | $41.83 | 5.3 cents |
| Crime and legal services | 278 | $10.77 | $19.46 | $48.91 | 5.1 cents |
| Food, agriculture, and nutrition | 186 | $12.06 | $24.72 | $55.95 | 4.0 cents |
| Community improvement | 383 | $11.88 | $24.80 | $60.53 | 4.0 cents |
Source: StratusLIVE analysis of IRS Form 990 e-file data (NCCS), tax years 2023 and 2024. Mission groups are IRS NTEE major groups. Smaller groups are left out here; public safety and disaster relief, for example, has 64 organizations with a ratio and a median of $43.70.
Part of the spread is what counts as raised. Form 990 treats donated goods as contributions. That likely lifts the ratio for groups such as food, agriculture, and nutrition, where food banks receive donated food. Funding mix matters too, because government grants cost little to raise.
An arts organization raising $10 per dollar sits above the arts median and below the human services median. When a poster on r/nonprofit said their development team was being judged against the profit of the bar and the concession stand, one reply made the same point: the right number depends on the field and the size of the organization. Compare yourself with your own mission group, and see the full nonprofit fundraising benchmarks by size and mission for the rest.
Why do nearly half of nonprofits show no ratio?
Because they report no fundraising expense. Of the 157,518 organizations in our data that reported contributions, 75,876 (48%) reported zero on Part I line 16b. The share was 56% at $250,000 to $1 million and about 40% in every band above $1 million. Even among organizations with $1 million or more in contributions, one in three reported none.
Of the other 81,642, all but 20 reported fundraising expense above zero. Leaving out 2,114 ratios above $1,000 per dollar as reporting errors gives the 79,508 organizations in the tables above.
The pattern is two decades old. In 2004, the Nonprofit Overhead Cost Project at the Urban Institute and Indiana University found that 37 percent of nonprofits with private contributions of $50,000 or more reported no fundraising or special-event costs on their 2000 Form 990. Its definitions differ from ours, so the two figures don’t make a trend line. Both show the same gap.
The project’s case studies found several causes. Both organizations in the sample that reported zero fundraising cost did so in error. The costs of winning government grants were generally not counted as fundraising. And affiliated groups that report all fundraising in one entity leave zeros in the others.
Allocation is the cause most within your control. Form 990 Part IX splits every expense into program services, management and general, and fundraising. Each organization decides how to allocate shared costs such as salaries. When development staff time is coded to programs or management, fundraising expense can read as zero. If your own 990 shows zero, check how staff time is allocated before you compare. Our post on nonprofit overhead covers why these allocations matter beyond this ratio.
Is a higher fundraising efficiency ratio always better?
No. A high ratio can mean a strong donor base or too little spent on finding new donors. New donors cost more to win than current donors cost to keep. In the M+R Benchmarks 2026 study of 2025 results, direct mail to active donors returned an average of $4.51 for every dollar spent. Mail to acquisition audiences returned $0.41.
An organization building its donor base shows a lower ratio until that work pays off. Read the ratio beside two other numbers: contribution growth over three years and donor retention. A high ratio with flat or falling contributions is a reason to ask whether enough is going into new donors. For the channel numbers behind acquisition and renewal, see direct mail fundraising metrics.
How to calculate your fundraising efficiency ratio
- Take contributions and grants from Part I line 8 of your most recent Form 990, or from your audited financial statements for the same year.
- Take total fundraising expenses from Part I line 16b, which carries the fundraising column of the statement of functional expenses (Part IX).
- Divide contributions by fundraising expense to get dollars raised per dollar spent. Divide the other way for the cost to raise a dollar.
- Compare the result with organizations in the same mission group and revenue band. Use the tables above or your own cohort.
- Repeat for the two prior years. One year can mislead because of a capital campaign, a bequest, or a change in how costs are allocated.
For 501(c)(3)s with $250,000 to $250 million in revenue that file the full Form 990, the free lookup does steps 1 to 4 from the newest filing. Search your organization by name or EIN to see its percentiles before filling in any form.
Why your internal number differs from your 990
Most development teams track their own cost to raise a dollar. It rarely matches the 990, because the two usually count different things. Teams don’t always agree on the internal version either: on the Blackbaud Community, development staff compare notes on whether pledges count or only cash received.
- What counts as raised. Part I line 8 includes government grants and donated goods. Many internal figures count only private cash gifts from fundraising activity.
- What counts as spent. The 990 uses your allocation of shared costs, including development salaries. The IRS instructions send the direct costs of fundraising events to Part VIII line 8b, outside fundraising expense. That can make an event-heavy program look more efficient on the 990 than in your own books. Mailings that combine an appeal with program content can split their joint costs between program and fundraising. Part IX line 26 discloses that split. Internal figures often count only direct campaign costs.
- When it counts. The 990 follows the accounting method in your books. Under the accrual basis used in audited statements, an unconditional multiyear pledge counts in the year it is made. Many internal reports count cash as it arrives.
- Which period. The 990 covers your fiscal year. Internal reports often run by calendar year or campaign.
Use the 990 figure to compare with peers, who filed under the same rules. Use your internal figures by channel and appeal to decide where the next fundraising dollar should go. Our comparison of workplace giving and traditional fundraising looks at cost by channel.
Compare your nonprofit with its peers
The tables show group medians. Your own position takes one search. Compare your nonprofit to peers: find it by name or EIN and see a percentile for its fundraising efficiency and contribution growth against organizations of its mission and size. The full report adds four more metrics and a three-year trend. It asks for a first name and work email.
Frequently asked questions
What is the average cost to raise a dollar for a nonprofit?
About 7 cents at the median, on public Form 990 data. Among 79,508 U.S. 501(c)(3) organizations with $250,000 to $250 million in revenue that reported fundraising expense for tax year 2023 or 2024, the median raised $14.60 per $1 spent. That is 6.8 cents to raise a dollar. The middle half spent between 2.5 and 15.1 cents. The 20-cent and 35-cent figures often quoted are watchdog ceilings, not averages. Surveys that count costs differently report more: Marts & Lundy's 2025 study found a median of 18 cents.
How do you calculate a nonprofit's fundraising efficiency ratio?
Divide contributions by fundraising expense for the same fiscal year. On Form 990, that is Part I line 8 (contributions and grants) divided by Part I line 16b (total fundraising expenses). The result is dollars raised per dollar spent. Divide the other way, fundraising expense by contributions, to get the cost to raise a dollar. Compare the result with organizations of the same mission and size, and look at three years rather than one.
How does Charity Navigator score fundraising efficiency?
Charity Navigator divides average fundraising expenses (Form 990 Part IX line 25 column D) by average total contributions (Part VIII line 1h) over the three most recent fiscal years. A charity gets full credit at 20 cents or less per dollar, no credit above 50 cents, and scaled credit in between. The metric applies only to donor-supported charities with more than $2 million in revenue. Charities whose contributions are mostly physical goods are scored on a stricter scale.
Is a high cost to raise a dollar always bad?
No. Winning new donors costs more than keeping current ones, so an organization building its donor base shows a higher cost for a while. Mission matters too. Arts organizations with $3 million to $10 million in revenue spent a median of 12 cents to raise a dollar, against 4 cents in food, agriculture, and nutrition. Read a high cost as a prompt to look closer. Compare it with peers of the same mission and size over three years.
Why does our Form 990 show zero fundraising expense?
Often because of how costs are allocated. Form 990 Part IX splits expenses into program services, management and general, and fundraising. Each organization decides how to allocate shared costs such as salaries. If development staff time is coded to programs or management, fundraising expense can show as zero. Zeros also come from fundraising done by an affiliated organization, grant-seeking costs left out of fundraising, and plain errors. In our 2023 and 2024 data, 48% of organizations that received contributions reported none.
Does the fundraising efficiency ratio on Form 990 include government grants?
Yes. Part I line 8 of Form 990 carries the total from Part VIII line 1h. That total includes government grants and donated goods as well as gifts from individuals, foundations, and companies. An organization funded mostly by government grants can show a high ratio without a large individual giving program. The direct costs of fundraising events also go on Part VIII line 8b rather than into fundraising expense. Both are reasons a 990 ratio and an internal figure rarely match.
Should staff salaries count in cost to raise a dollar?
Yes, if you want a number you can compare. On Form 990, the fundraising column of Part IX includes the salaries and benefits of staff who raise money, allocated by the share of their time spent on fundraising. It also carries a share of costs such as rent and systems. Many internal figures count only direct costs such as printing and postage. That makes fundraising look cheaper than it is. Charity Navigator and peer comparisons both start from the 990 figure.
Is a 4 to 1 fundraising return good?
It passes the published standards but sits in the bottom quarter of filers. A 4 to 1 return is $4 raised per $1 spent, or 25 cents to raise a dollar. That meets the BBB Wise Giving Alliance's 35% standard and CharityWatch's test of $25 to raise $100. In our 2023 and 2024 Form 990 data, the bottom quarter raised less than $6.63 per dollar. Channel matters: mail to active donors returned $4.51 per dollar in M+R's 2026 study.